Wêne:Earth's Heat Accumulation.png
Here nagîvasyonê
Here lêgerînê

Mezinahiya vê pêşdîtinê: 800 × 564 pîksel. Resolusyonên din: 320 × 225 pîksel | 640 × 451 pîksel | 954 × 672 pîksel.
Dosyeya orjînal (954 × 672 pixel, mezinbûnê data: 144 KB, MIME-typ: image/png)
Danasîn
| Danasîn |
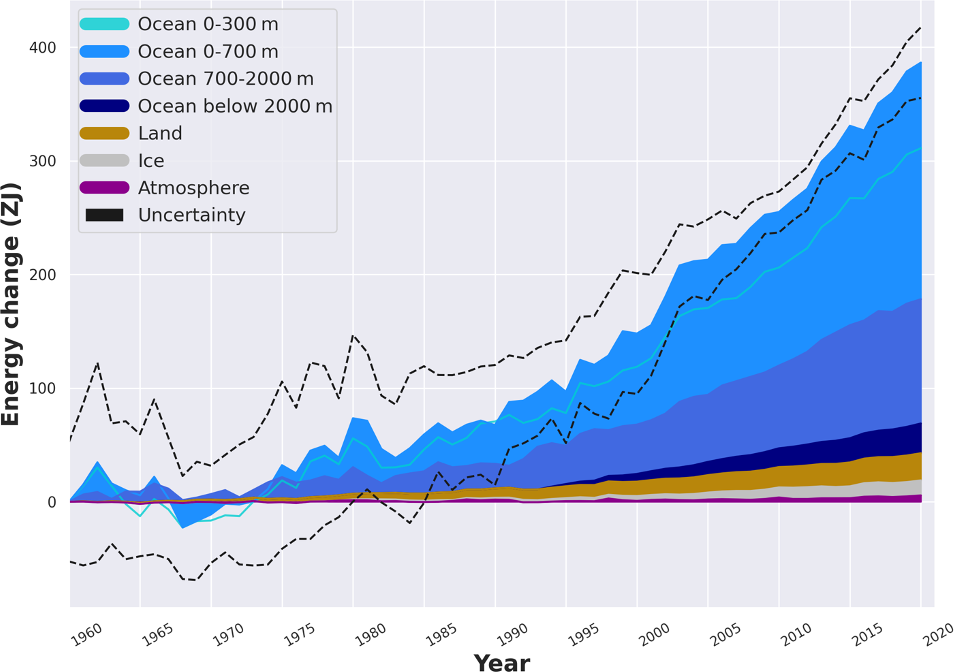
English: This graph shows the buildup of excess heat (thermal energy) in the ocean, land, ice, and atmospheric components of the Earth system since year 1960. The energy change is evaluated as ZettaJoules (=1021 Joules). The heat propagation to greater ocean depths with time is evident. Dashed lines bracket the total uncertainty of the data from the four components. Red line compares the trend of CERES satellite-based observations of the energy flow imbalance at top of atmosphere (TOA). Credits: |
| Tarîx | |
| Çavkanî | https://essd.copernicus.org/articles/15/1675/2023/essd-15-1675-2023-f08.png |
| Xwedî | Karina von Schuckmann, et al. |
Lîsans
This file is licensed under the Creative Commons Attribution-Share Alike 4.0 International license.
- Tu azad î:
- parve bike – ji bo kopîkirin, belavkirin û weşandina xebatê
- ji bo guhartin û adaptekirina naverokê – ji bo adaptekirina xebatê
- Di bin van mercan de:
- isnad – Divê tu isnadeke maqûl bikî, lînekek pêşkêş bikî ji bo lîsansê, û diyar bikî ku guhartin hatiye kirin an na. Tu dikarî vê yekê bi adilî bi cih bînî, lê ne bi awayê ku wekî lîsansor te an bikaranîna te pejirandibe.
- parvekirinê mîna hev – Ger tu materyalê biguherînî, bizivirînî formeke din, an ava bikî divê beşdariyên xwe di bin eynî lîsansê an lîsansa hevaheng de wekî ya eslî belav bikî.
Dîroka daneyê
Ji bo dîtina guhartoya wê demê bişkoka dîrokê bitikîne.
| Tarîx/Wext | Wêneyê biçûk | Mezinahî | Bikarhêner | Şirove | |
|---|---|---|---|---|---|
| niha | 15:10, 9 gulan 2023 | | 954 x 672 (144 KB) | wikimediacommons>Bikesrcool | updated version from von Schuckmann, et al. (2023) CCA4.0 https://essd.copernicus.org/articles/15/1675/2023/ |
Bikaranîna pelê
Ev rûpelên li jêr vê dosyeyê bi kar tînin: